Breadboard four-switch buck-boost converter
I assembled a four-switch bidirectional buck-boost converter and modelled its control system in Simulink. The 15 to 60 V output ramp has been checked in simulation. The component measurements below come from an LCR meter; they are separate from a powered converter test.
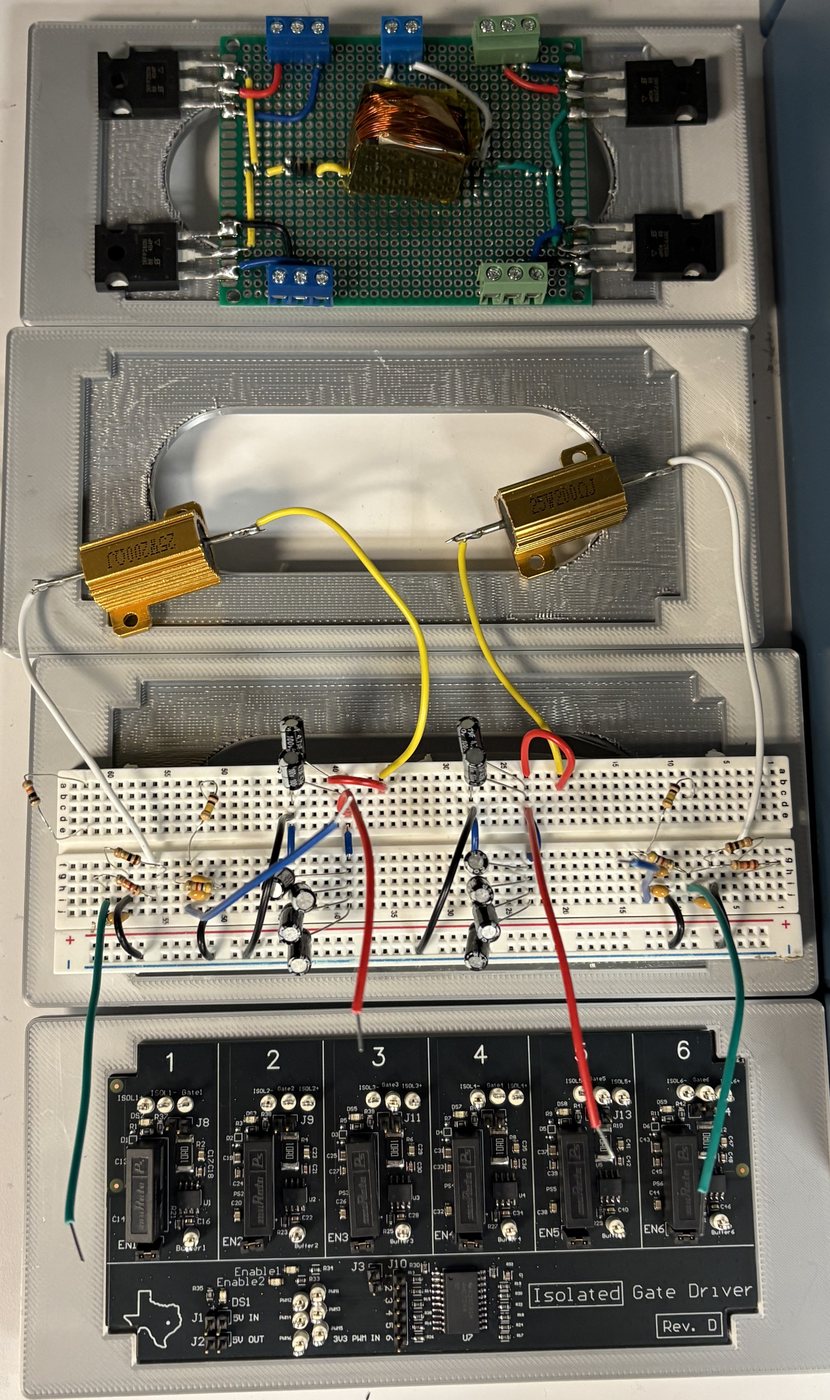
A 30 V supply feeds side A. Four IRFP260N MOSFETs switch at 100 kHz into a 200 Ω load on side B. The 10 s triangular reference passes through buck, transition and boost operation. My Rev D isolated gate-drive board supplies the gate signals, with an isolated 15 V supply for each gate.
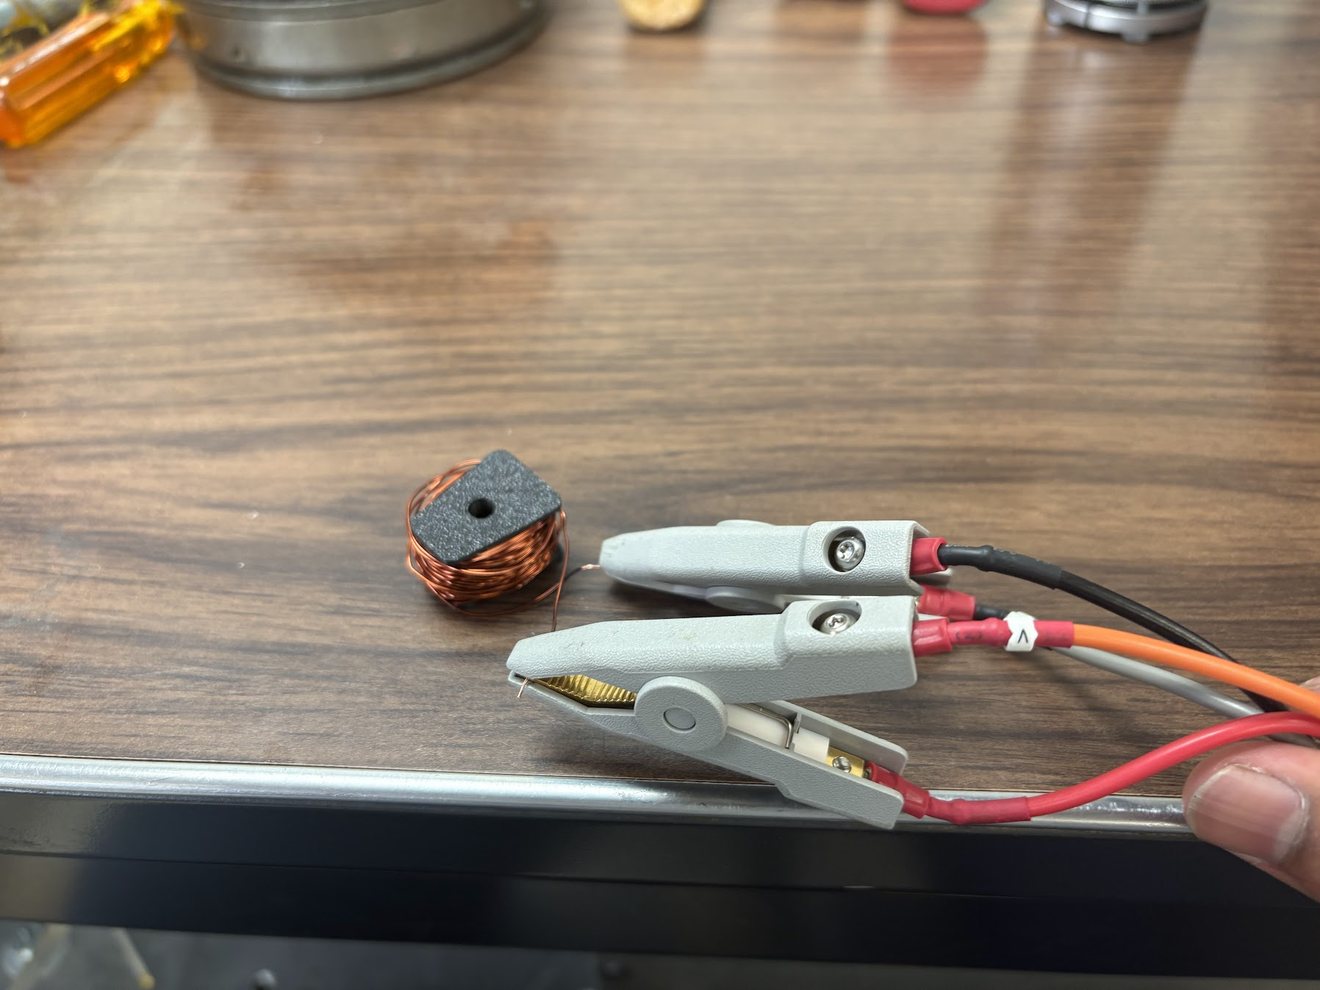
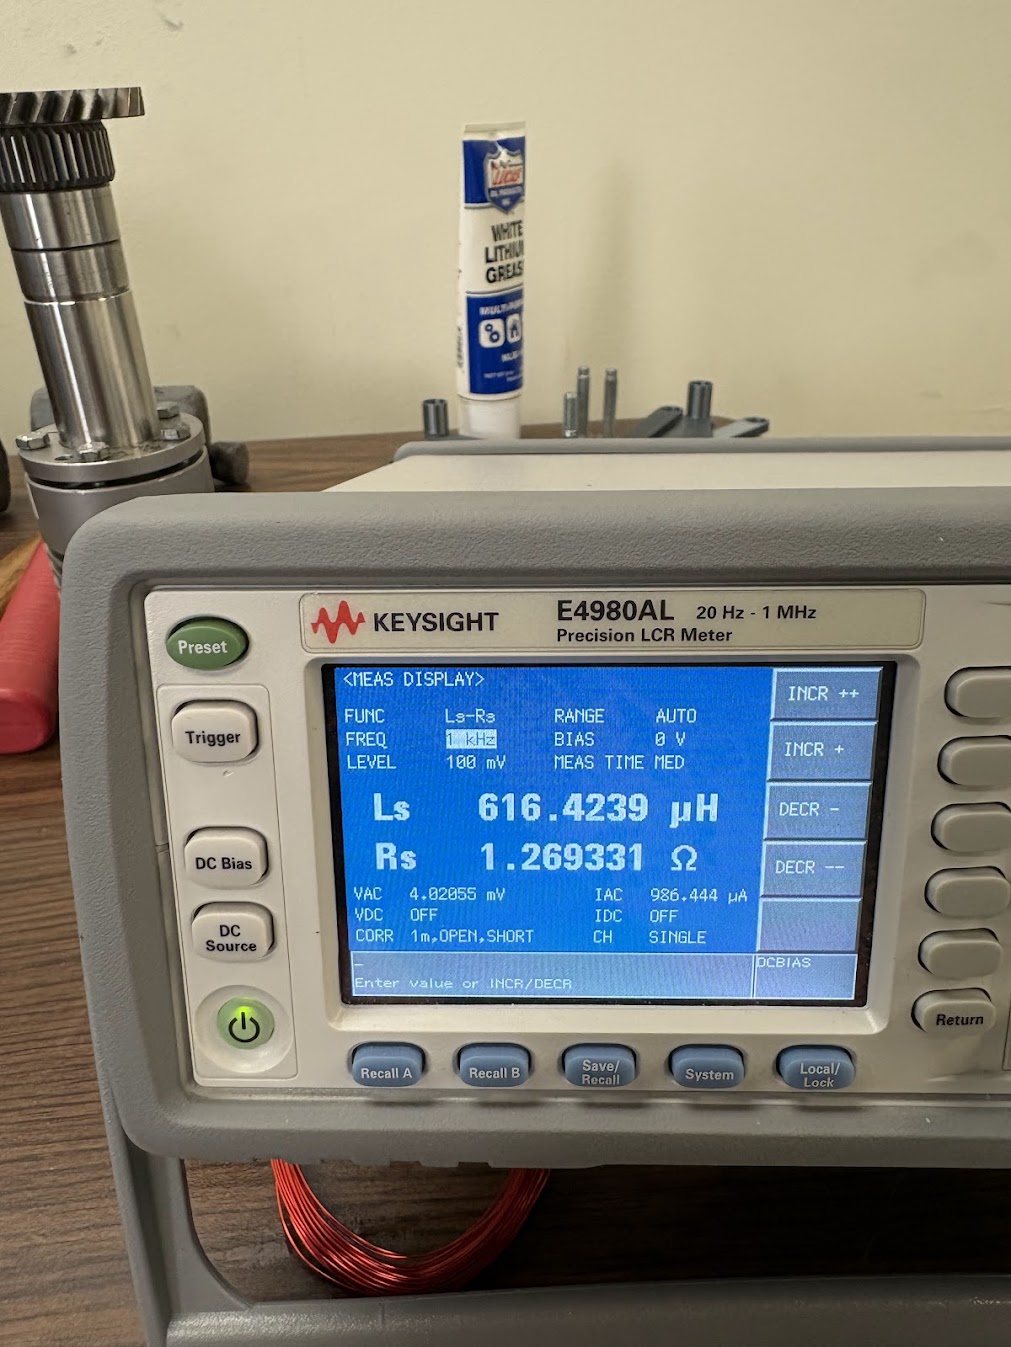
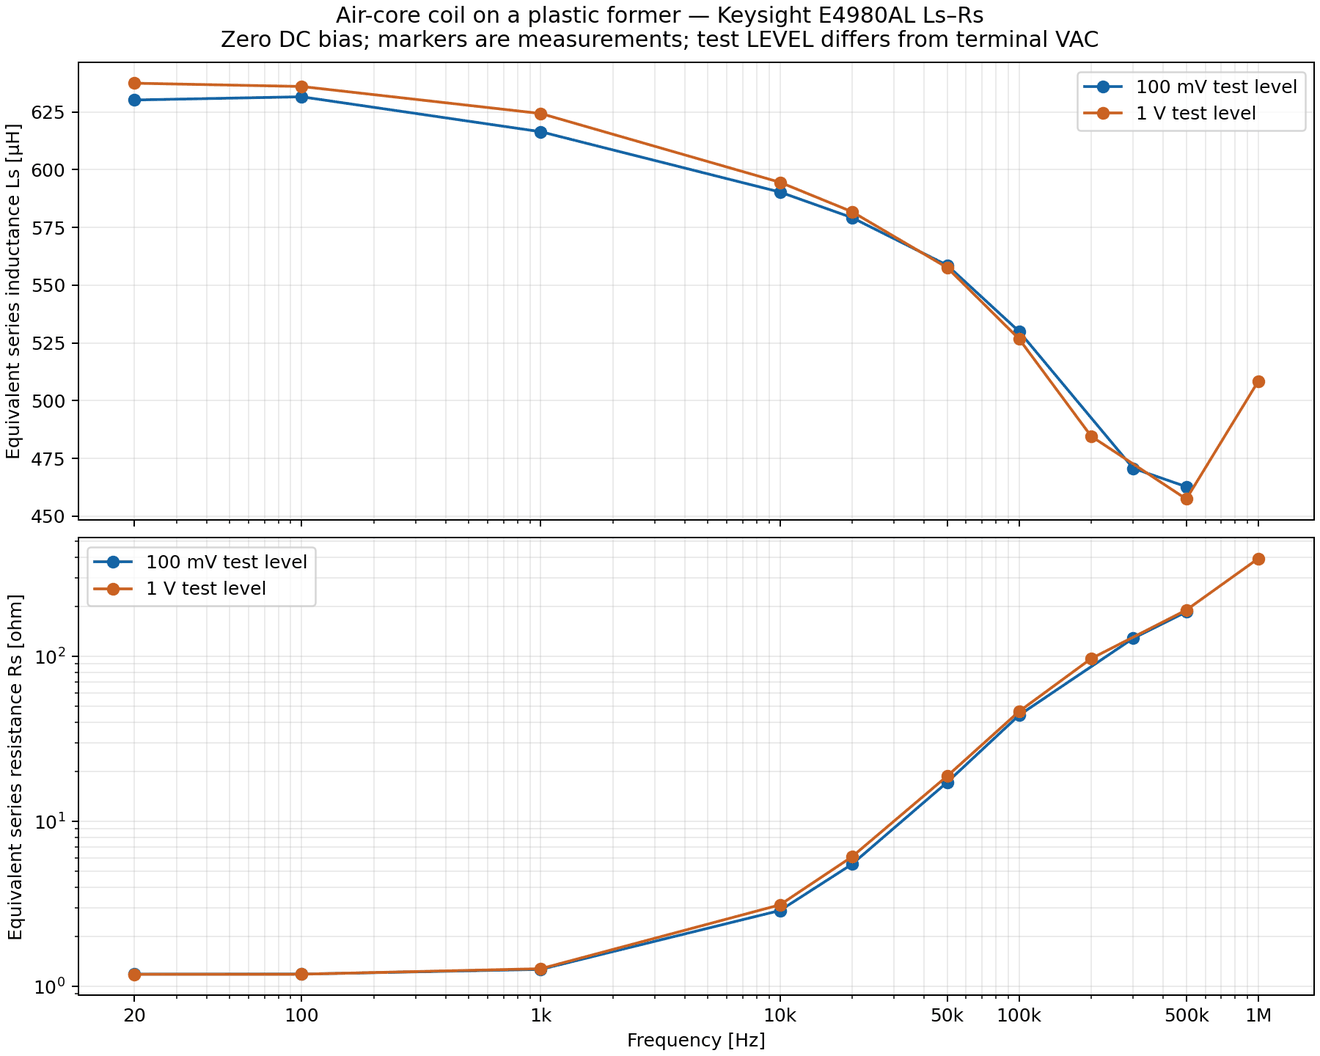
The inductor is a spare stator coil from my dual-rotor axial flux motor. It is magnet wire on a 3D-printed bobbin, with no magnetic core. I measured the coil with an LCR meter from 20 Hz to 1 MHz. The inductance is 558 µH at 50 kHz and 526.7 µH at 100 kHz. The series resistance increases from 1.19 Ω near DC to 46 Ω at 100 kHz.
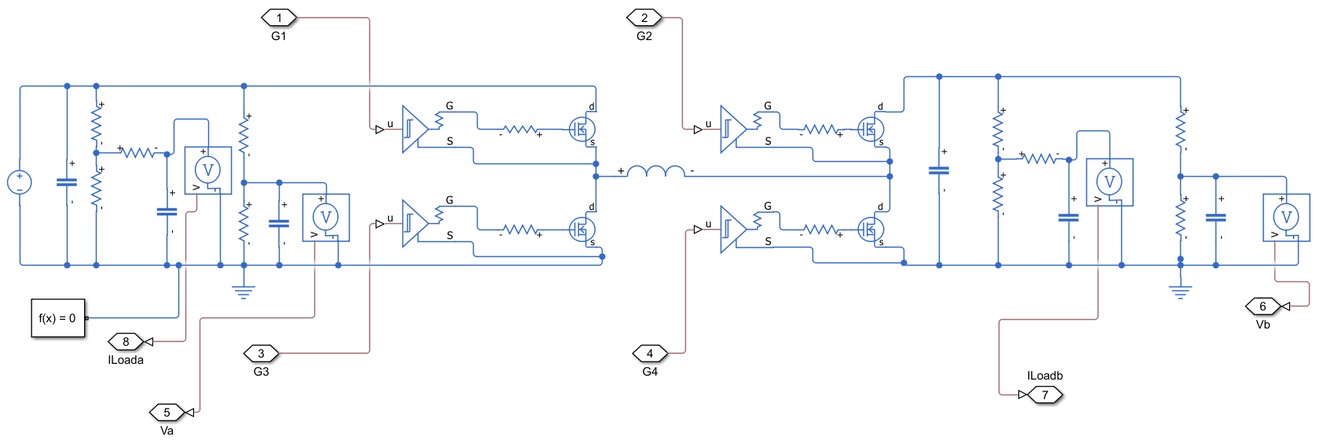
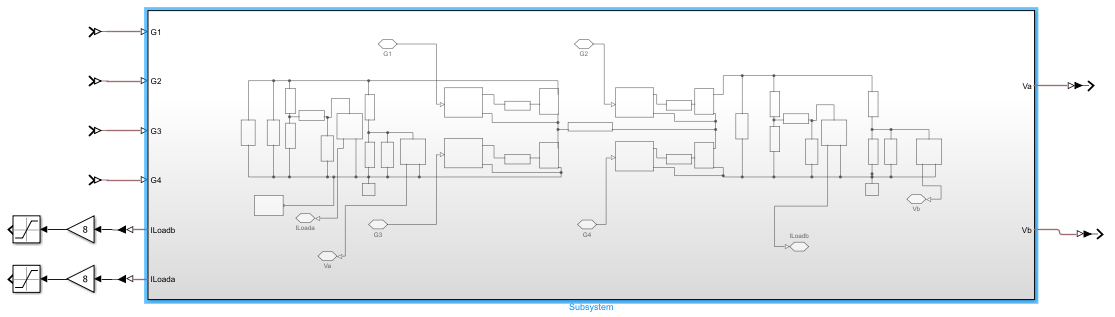
Operating modes
Leg A switches side A, the input. Leg B switches side B, the output. \(D_A\) and \(D_B\) are the high-side duty cycles of the two legs. Volt-second balance on the inductor gives one equation with two unknowns:
\[ D_A V_{in} = D_B V_{out} \]
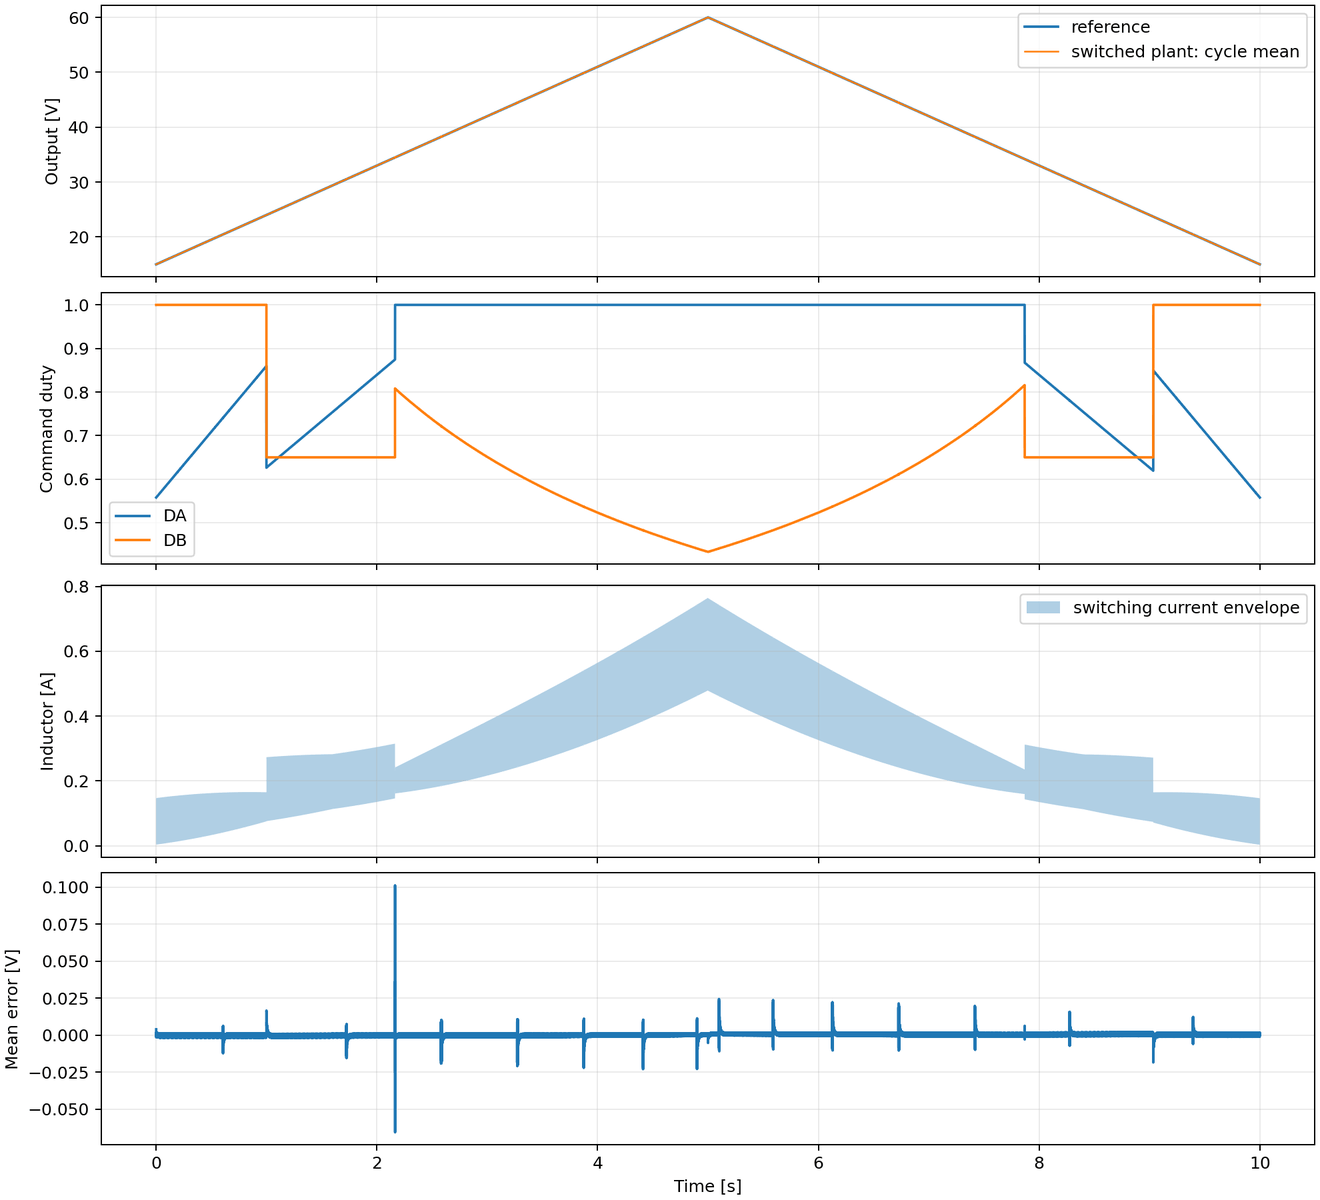
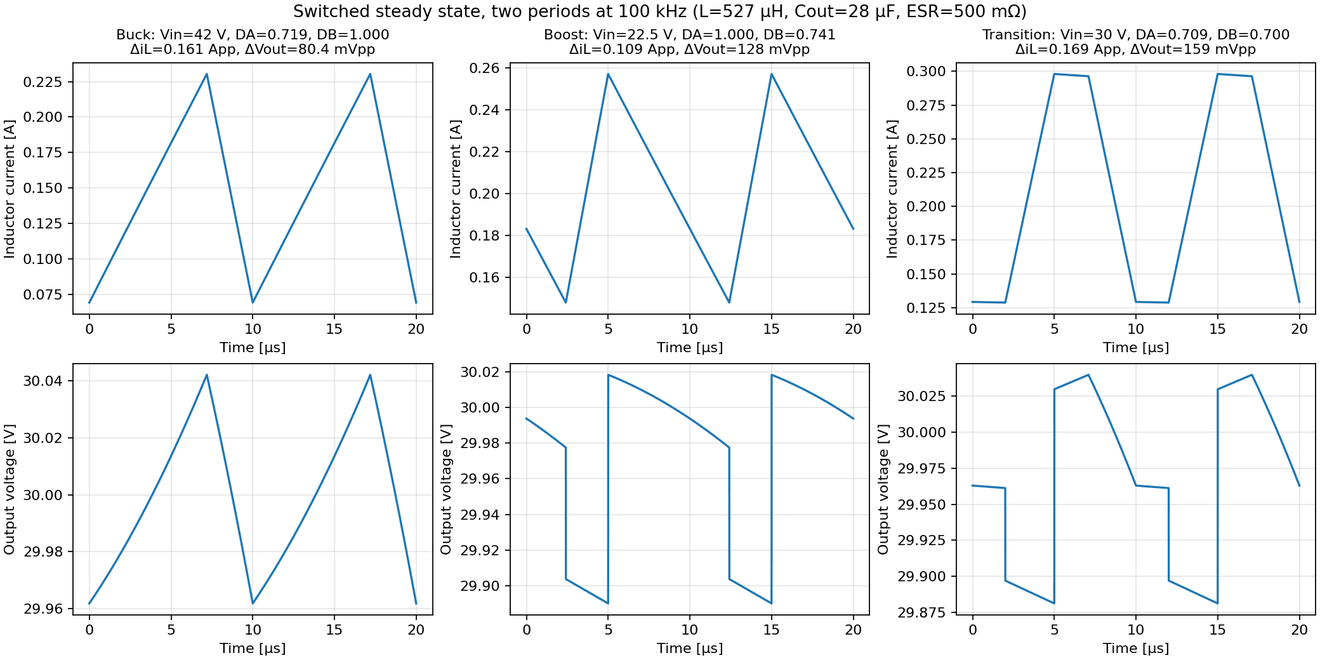
In buck mode, leg B stays on, with \(D_B = 1\), and \(D_A = V_{out}/V_{in}\). In boost mode, leg A stays on, with \(D_A = 1\), and \(D_B = V_{in}/V_{out}\). Near \(V_{out} = V_{in}\), both legs switch. I set \(D_B = 0.7\) and \(D_A = 0.7\,V_{out}/V_{in}\), and I shift leg B by half a period.
The minimum pulse width makes a wide transition band necessary. The dead time is 500 ns and the minimum conducting pulse is 500 ns. Their sum, 1 µs, is 10% of the 10 µs period. A switching leg can only use duty cycles from 0.1 to 0.9. The ratio \(M = V_{out}/V_{in}\) selects the mode, with buck below 0.80, boost above 1.15 and transition between them. With 30 V in, buck mode ends at 24 V and boost mode starts at 34.5 V.
Inductor ripple and the load
The inductor ripple in buck and boost mode is:
\[ \Delta I_{L,\mathrm{buck}} = \frac{(V_{in} - V_{out})\,D_A}{L f_s} \qquad \Delta I_{L,\mathrm{boost}} = \frac{V_{in}\,(1 - D_B)}{L f_s} \]
My first load was a 6.8 kΩ, 1 W resistor. At 60 V, that load draws 8.8 mA. At 50 kHz, the ripple is approximately 540 mA peak-to-peak. The inductor current goes far below zero in each cycle. To keep the current positive, \(I_{L,\mathrm{avg}}\) must be more than \(\Delta I_L / 2\). The two ends of the sweep give these limits:
\[ \text{15 V buck: } R < 4 L f_s = 210.7\ \Omega \qquad \text{60 V boost: } R < 16 L f_s = 842.7\ \Omega \]
At 100 kHz, the ripple is half of the 50 kHz value. A 200 Ω load then meets the limit at both ends. At 15 V, the minimum inductor current is 3.8 mA, which is a small positive margin. The disadvantage is the load power, which is \(V_{out}^2/R = 18\ \mathrm{W}\) at 60 V. The load must be a correctly mounted power resistor.
| Output | Mode | Load current | Load power | Inductor ripple |
|---|---|---|---|---|
| 15 V | buck | 75 mA | 1.1 W | 142 mA pp |
| 30 V | transition | 150 mA | 4.5 W | 171 mA pp |
| 60 V | boost | 300 mA | 18 W | 285 mA pp |
Sizing the capacitors
I set a target of 1% peak-to-peak ripple on both buses. Half of the target is for capacitance and half is for ESR. Each capacitor value comes from the charge that the capacitor absorbs in one cycle:
\[ C \ge \frac{\Delta Q}{\Delta V_C}, \qquad \Delta Q = \int_{\text{charging}} i_C\,dt \]
In buck mode, the output capacitor sees only the triangular ripple. In boost mode, it supplies the full load current while the output switch is off:
\[ C_{out} \ge \frac{\Delta I_L}{8 f_s\,\Delta V_C}\ \ \text{(buck)} \qquad C_{out} \ge \frac{I_{out}\,(1 - D_B)}{f_s\,\Delta V_C}\ \ \text{(boost)} \]
The boost case sets the value. At 60 V, \(0.30 \times 0.5 / (100\ \mathrm{kHz} \times 0.30\ \mathrm{V}) = 5\ \mu\mathrm{F}\). The input capacitor sees pulsed current in buck mode:
\[ C_{in} \ge \frac{I_{out}\,D_A (1 - D_A)}{f_s\,\Delta V_C} \]
With a fixed load resistor, \(I_{out}\) increases with \(D_A\). The worst buck point is \(D_A = 2/3\), at 20 V out. That point needs 1.48 µF, or 1.64 µF with the inductor ripple included. A sweep of all points in buck, transition and boost mode increases the input requirement to 3.3 µF in the transition band.
| Requirement | Input | Output |
|---|---|---|
| Minimum effective capacitance | 3.3 µF | 5.0 µF |
| Maximum RMS ripple current | 0.12 A | 0.31 A |
| ESR ceiling (half the ripple budget) | 0.46 Ω | 0.40 Ω |
| Capacitors ordered | 47 µF, 50 V | 6 × 4.7 µF, 100 V |
| Measured bank | not measured | 27.6 µF, 0.443 Ω at 100 kHz |
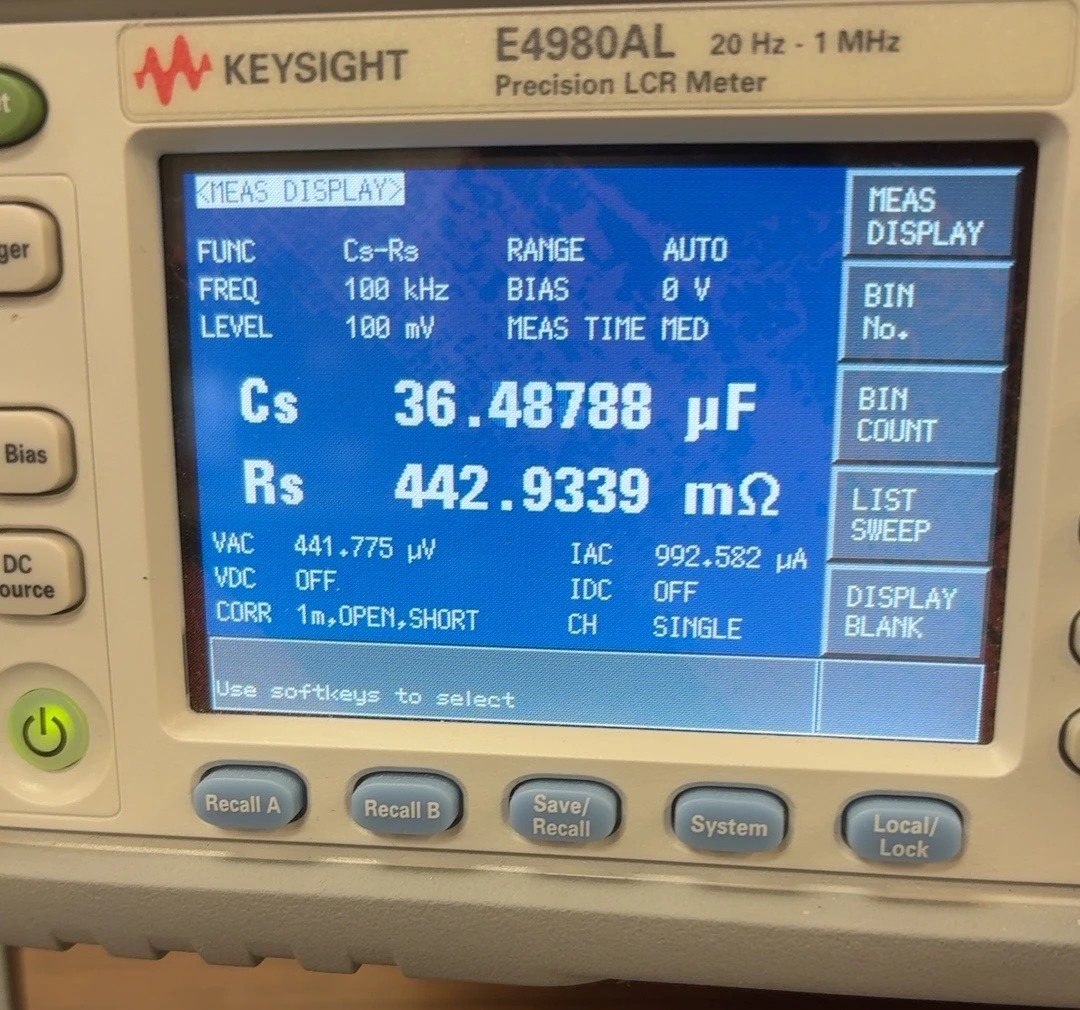
The capacitors come from a generic kit with no published ESR or ripple-current rating. Thus I measured the output bank of six capacitors in parallel on the Keysight E4980AL. At 100 kHz and a 100 mV test level, the ESR of the bank is 0.443 Ω. A multimeter reads 27.6 µF, which is within 2% of the 28.2 µF nominal value.
At 100 kHz, the meter shows 36.5 µF, which is more than the nominal value. The reactance of the bank at 100 kHz is only approximately 0.06 Ω, so a small series inductance changes the measured value. Approximately 20 nH in the clips and wires causes this difference.
The measured ESR is more than the 0.40 Ω ceiling from the half-and-half split. But the capacitance uses very little of the ripple budget. At 60 V, the peak inductor current of 0.742 A gives 0.33 V of ripple across the ESR. The capacitance adds approximately 0.05 V. The total, 0.38 V peak-to-peak, is approximately 0.6% of 60 V and meets the 1% target.
The converter is bidirectional, so side A must also operate at 60 V. The 47 µF input capacitor has a 50 V rating and cannot stay on side A. Side A needs a 100 V bank, the same as side B.
Gate drive and sensing
The gate-charge power for each switching FET, from the maximum gate charge of the IRFP260N, is:
\[ P_{gate} = Q_g V_{drive} f_s = 234\ \mathrm{nC} \times 15\ \mathrm{V} \times 100\ \mathrm{kHz} \approx 0.35\ \mathrm{W} \]
Each gate supply is a 1 W isolated converter. The 2 kΩ preload and the indicator LED on the board use approximately 0.2 W. Approximately 0.79 W remains, so operation at 100 kHz is possible. The datasheet gives the gate charge at 10 V, thus the real value at 15 V is higher. The Rev D board passed a bench test with a function generator at up to 2.5 MHz.
The controller measures the voltage on each bus. Both sides must operate up to 60 V, so the two channels are the same. Each channel has a 100 kΩ/4.7 kΩ divider and a 33 nF filter capacitor at the 12-bit ADC input. The full-scale voltage is 73.5 V, and 60 V gives 2.69 V at the pin. The filter corner is 1.07 kHz:
\[ f_c = \frac{1}{2\pi\,(R_{top} \parallel R_{bot})\,C} \]
The corner is approximately 50 times higher than the control-loop bandwidth and 100 times lower than the switching frequency.
A 1 Ω shunt in the ground return of each load measures the load current. An op-amp with a gain of 8 changes 0.3 A to 2.4 V at the ADC input. The controller calculates the average inductor current from the load current:
\[ I_{L,\mathrm{avg}} = \frac{I_{out}}{D_B} \]
This value is only an average. It does not show the peak current or the ripple.
Simulating the ramp
The control law uses input feedforward and a PI correction on the output error. The commanded ratio starts at \(V_{ref}/V_{in}\). The PI term corrects for the voltage drop across the coil and the FETs. The simulation runs the controller once per switching period on the sampled and quantized divider voltages. The power stage includes 500 ns of dead time and body-diode conduction.
Over the full 10 s ramp, the cycle-averaged output stays within 0.105 V of the reference. The ramp has four mode changes and no duty-cycle clamping. LTspice replays of the switching commands at each mode change agree with this result. The largest error occurred at the boost handoff. This error decreased when the output-leg duty updated before the input-leg duty.
The capacitor ESR has the largest effect on the ripple. With 0.1 Ω of total ESR on each bus, the worst output ripple is 0.19% of the output voltage. The ripple increases to 0.64% at 0.5 Ω and 1.27% at 1 Ω. The measured output bank has 0.443 Ω, which is less than the 0.5 Ω case.
The simulation and the calculations on this page cover power flow from side A to side B only.
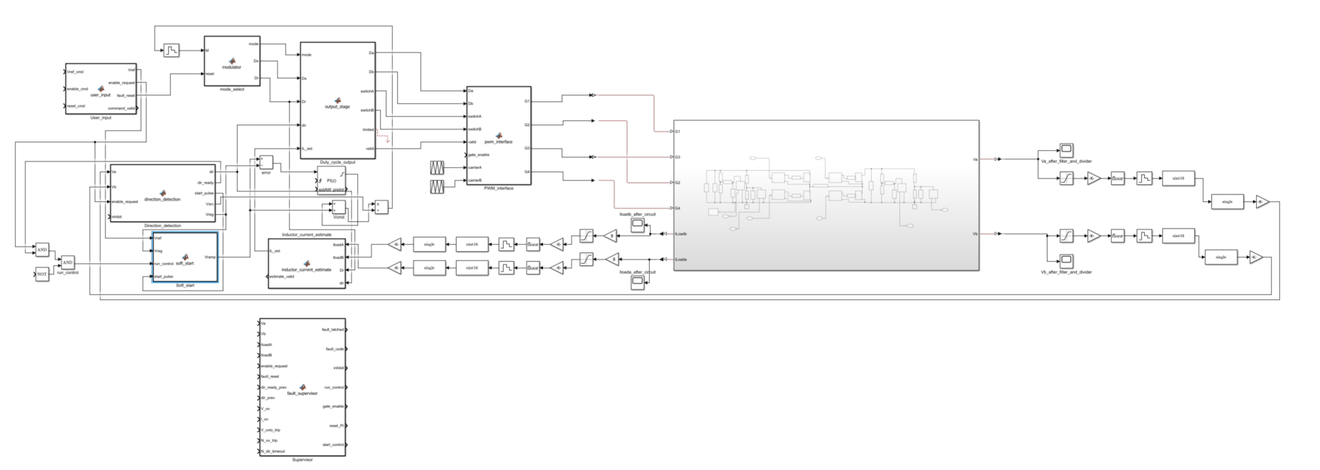
Control system model
My latest work is a Simulink model of the full control system around the power stage. The signal path starts at the user-input block. This block takes the voltage reference, enable and reset commands, and it outputs the reference with enable-request, fault-reset and command-valid flags.
A direction-detection block takes the two bus voltages Va and Vb. It outputs the power-flow direction, a direction-ready flag, a start pulse, and the source and regulated voltages. A soft-start block takes the reference, the regulated voltage, run control and the start pulse, and outputs a ramped reference. The error from this ramp drives a discrete PI controller with an anti-windup preset.
The mode-select block takes the conversion ratio M and outputs the mode and two duty cycles. The duty-cycle output stage converts these to the leg duty cycles Da and Db and the switch states for each leg. It also outputs limited and valid flags. The PWM interface takes these signals, a gate-enable input and two carriers, and produces the gate signals G1 to G4 for the power stage.
On the feedback side, the model includes the ADC. Each bus voltage and each load current goes through a gain, saturation, floor and quantization step, and a uint16 conversion before the controller uses it. An inductor-current-estimate block calculates the inductor current from the two load currents, the duty cycle and the direction.
A fault supervisor takes both bus voltages and both load currents, with over-voltage, over-current and under-voltage trip limits and a direction timeout. It outputs a latched fault and fault code, an inhibit signal, run-control and gate-enable signals, and PI reset and start-control signals.
The coil
The air core cannot saturate. Heat, not saturation, sets the current limit. At the 60 V point, the average current is 0.6 A and the ripple is 0.285 A peak-to-peak. From the measured resistances, the estimated loss is approximately 0.74 W. Of this loss, 0.43 W comes from the DC current and 0.31 W comes from the ripple at 100 kHz.