← Darsh Patel

MIRAGE rover power model

SOMTECH · Rover power · this semester

A MATLAB/Simulink model of the whole MIRAGE rover that drives each 2027 URC mission and logs power at the battery, the motor bus and every converter rail, to size the pack and power system.

It drives the rover along routes planned on a 1 m elevation map of the Mars Desert Research Station, runs each mission's tasks, and simulates the tyres, the drive and steering motors with their MD80 controllers, the arm, the SEAS science platform, the electronics and the battery. Every run is checked for validity and repeated at half the step size to confirm it converged.

The current study feeds the motor controllers straight from a 60-cell Samsung 50E pack in a 10S6P arrangement, with no 42 V converter. The hardest case, delivery on gravel with heavy loads, draws about 430 Wh, or 41% of the pack. Peak pack current is 16.9 A against a 59 A cell limit, and the drive motors held their commanded speed in every run, even with the bus sagging to 28.6 V near empty. Against a 12S5P pack behind a 42 V converter, it uses 1 to 3% less energy.

The electronics, not the motors, set the energy: the Jetsons, radios and sensors take 61 to 74% of each mission. Near empty, the limit is the 24 V converter that feeds the science payload. These are simulation results with assumed electronics loads and cell curves; nothing has been measured on the rover yet.
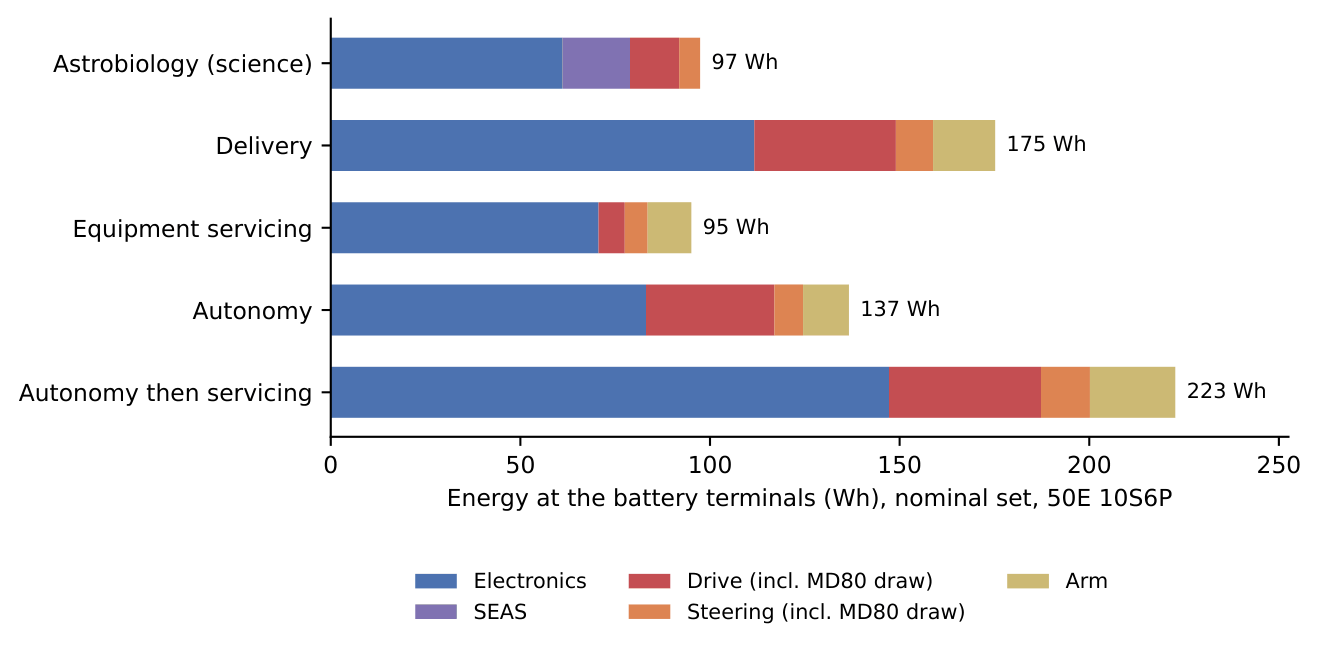
Stacked bars of battery energy per mission split into electronics, SEAS, drive, steering and arm, from 95 Wh for equipment servicing to 223 Wh for autonomy then servicing.
Where each mission's battery energy goes, nominal case. Electronics stay on for the whole mission, including the 15-minute powered setup, so they outweigh driving in every mission.
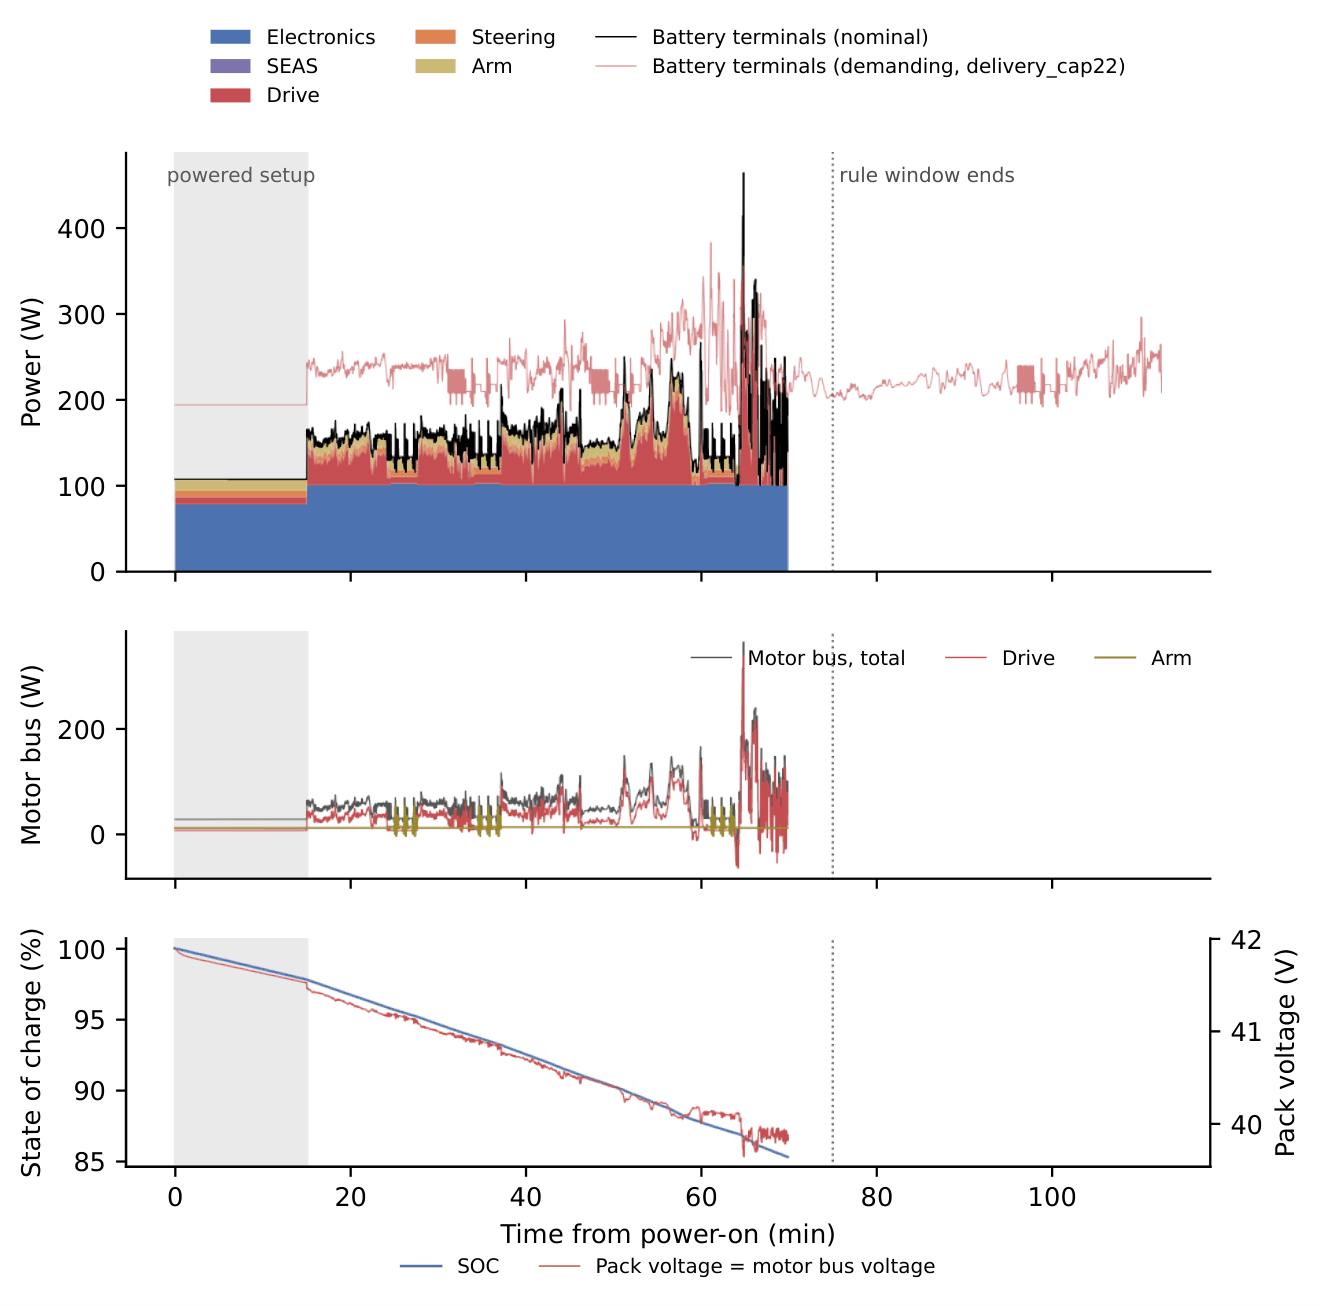
Three stacked time plots of the delivery mission: battery power by load, motor-bus power, and state of charge falling from 100 to 85 percent with pack voltage.
The delivery mission minute by minute: battery power split by load (top), motor-bus power (middle), and state of charge and pack voltage (bottom). The thin red trace is the demanding case, which is slower by design and runs past the 60-minute window.
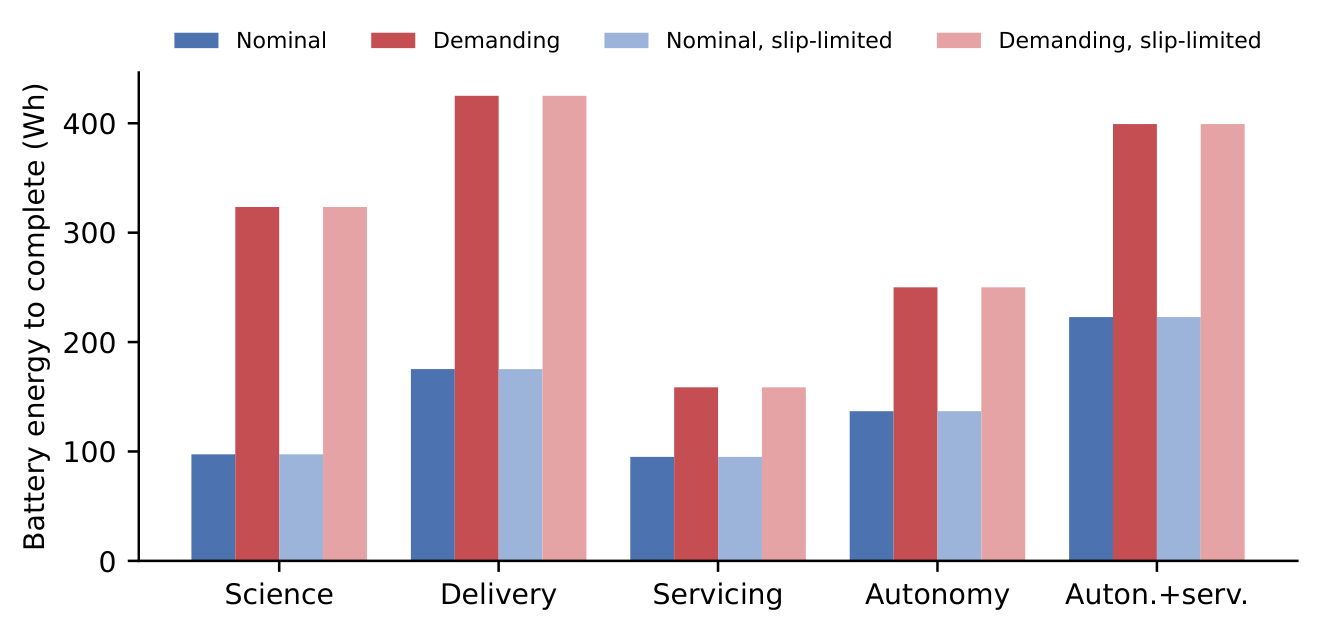
Grouped bars of battery energy per mission for the nominal, demanding and two slip-limited cases.
Battery energy to finish each mission under nominal and demanding assumptions (gravel, heavier loads, slower driving), with and without a slip-limiting traction controller. Demanding delivery is the largest; the slip limiter barely changes the totals.
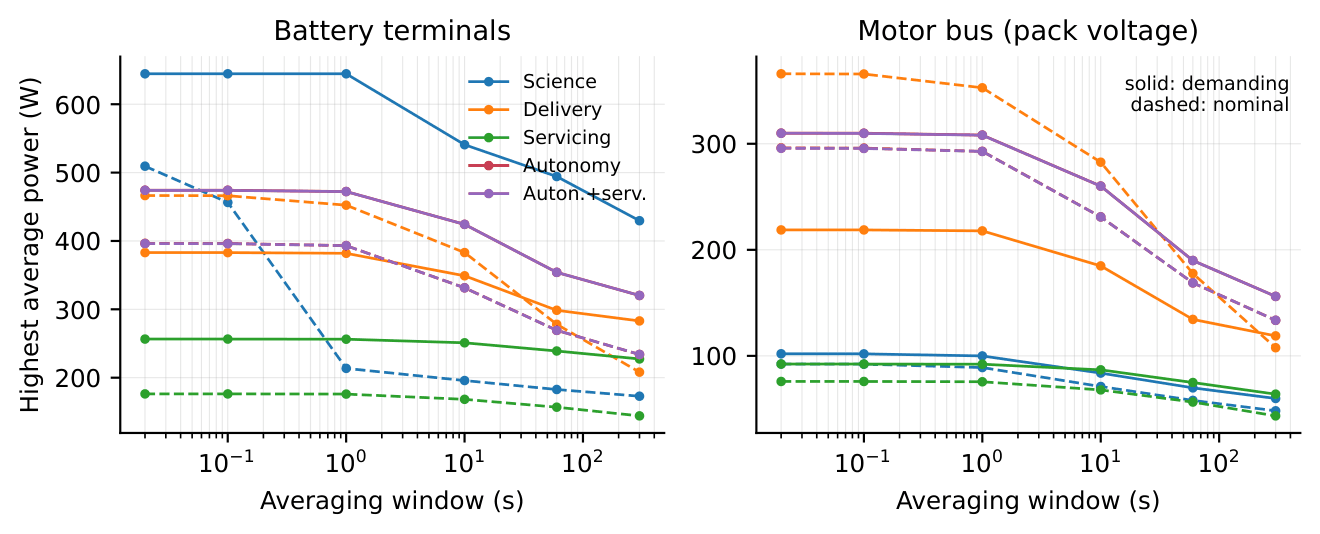
Power-duration curves for each mission at the battery terminals and on the motor bus, for the nominal and demanding cases.
Highest average power over any window, from a single solver step to five minutes. Short windows size the fuses, seconds size the wiring and FETs, and minutes size the cells and converters.
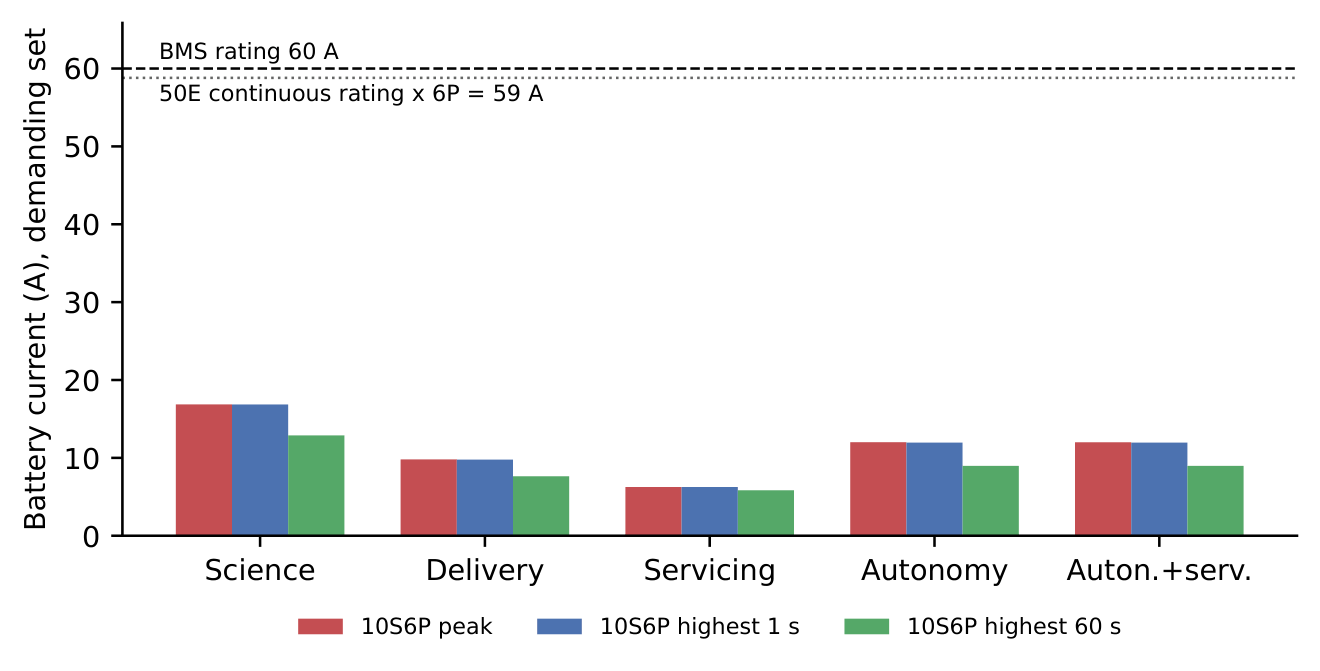
Bar chart of battery current per mission, all under 17 A, with the 60 A BMS and 59 A cell limits drawn as dashed lines near the top.
Peak, 1 s and 60 s battery current in the demanding case, against the 60 A BMS rating and the 59 A continuous limit of six 50E cells in parallel. The worst mission, science, peaks at 16.9 A.