Home Linux server
Four Ubuntu machines share batch electromagnetic simulations for my robot joint-motor study. Docker Swarm schedules the work, NFS shares the files, and Tailscale connects the machines.
A Dell Inspiron 14 laptop leads the Swarm and hosts the shared folder. Dell OptiPlex 755 and 780 desktops are also managers, and an ASUS laptop is a worker. The diagram and machine list below show the setup.
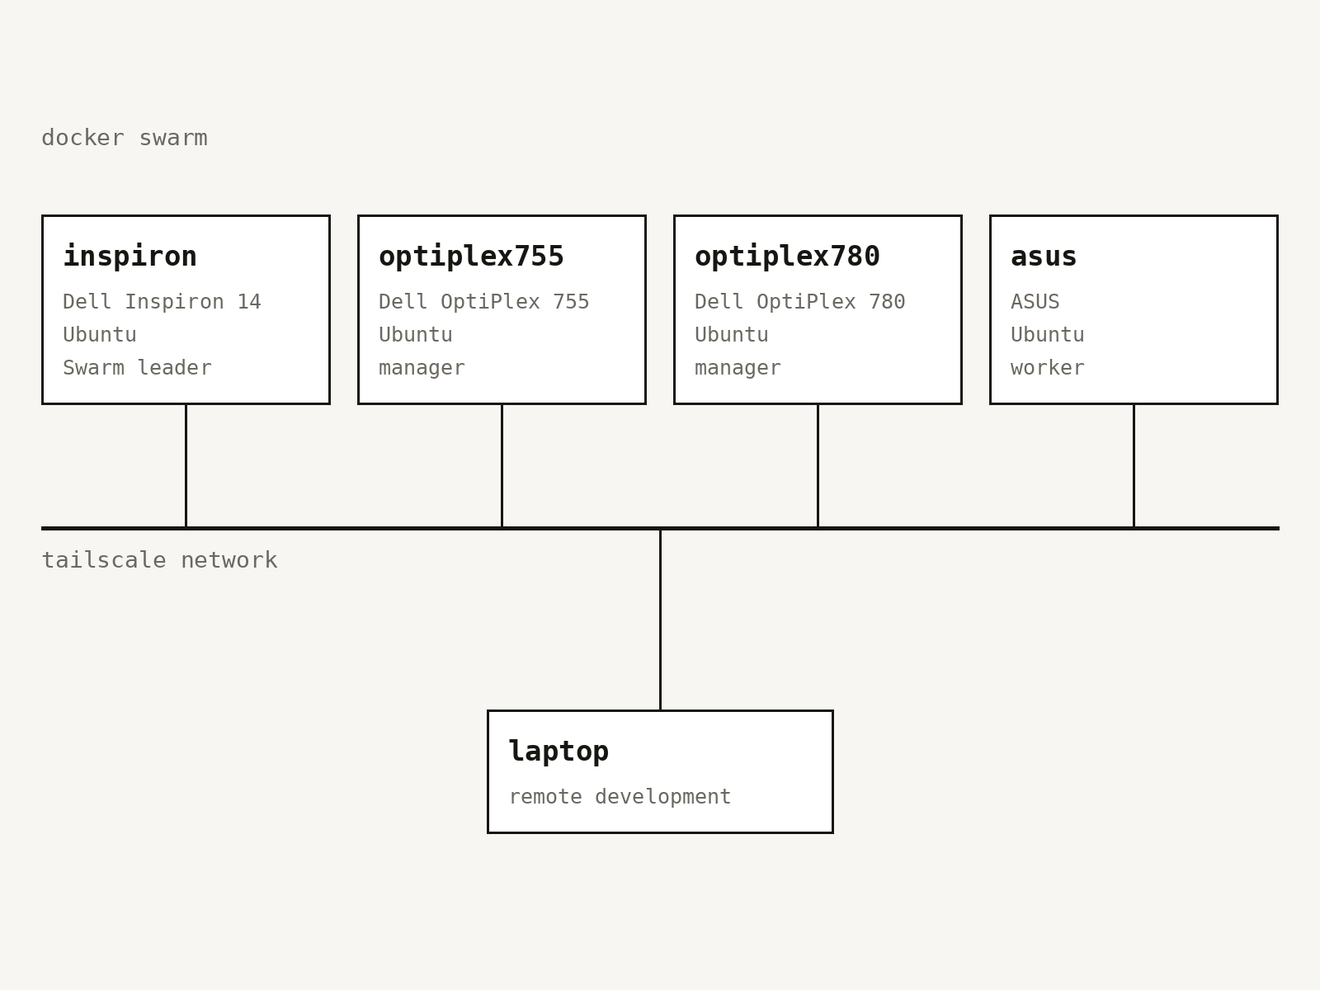
Machines
The machines are old and uneven, so the work is split by speed. A Core 2 Duo takes about 4 to 5 times as long per FEMM solve as the Inspiron.
| Machine | CPU | RAM | Swarm role | FEMM workers |
|---|---|---|---|---|
| inspiron | i7-11390H, 4 cores / 8 threads | 14 GB | leader, NFS server, monitoring | 5 |
| optiplex755 | Core 2 Duo E4600, 2 cores | 3 GB | manager | 2 |
| optiplex780 | Core 2 Duo E7500, 2 cores | 3 GB | manager | 2 |
| asus | i3-4030U, 2 cores / 4 threads | 3 GB | worker | 1 |
Batch simulation
FEMM 4.2 is a Windows program, so each node runs it under Wine inside a Docker container. Jobs sit in a queue on the shared NFS folder. A worker claims a job by creating its directory, which is atomic on NFS, so no scheduler service is needed. A claim left by a dead worker is picked up again after a timeout.
Before a node's results count, each of its workers re-solves a reference design and has to match the Inspiron's torque and flux to 1 part in 10,000. In November 2026 all three nodes matched exactly, and ten workers shared the axial-flux sweep of the motor study. Elmer runs the 3D solves on the Inspiron.
Monitoring
node-exporter and cAdvisor report machine and container metrics to Prometheus. Grafana Alloy ships every container log and the system journal from all four nodes to Loki, which keeps 14 days. Batch workers push their progress (busy, units done, units failed, time of last success) to a Prometheus Pushgateway. Grafana shows all of it.
Alert rules cover a node going down, low disk or memory, a container restarting in a loop, a worker that is busy but has finished nothing for two hours, repeated job failures, and Wine crash storms in the logs. The alerts are not pushed to my phone. The AI agents that run the jobs read them with a small cluster-health command, which prints alerts, node load and worker progress and returns an exit code by severity.
Setting this up found three problems that had gone unnoticed. An old worker on the ASUS had been crashing in a loop under Wine for two days. The ASUS had moved to a new DHCP address, so Prometheus had silently stopped reading it; it now uses the fixed Tailscale addresses. And the ASUS had dropped out of the Swarm overlay network until Docker was restarted.